On the morning of Wednesday, September 20, Professor Susan Jacobson and about 20 of her SCJ students participated in a citizen science effort to collect information about King Tide flooding in the Shorecrest neighborhood of Miami, a neighborhood near the intersection of NE 10th Avenue and NE 79th Street. According to epa.gov, King Tide flooding is the highest predicted high tide of the year at a coastal location.
Professor Jacobson worked with Dr. Tiffany Troxler, Director of the Sea Level Solutions Center at FIU, and an initiative called Community Health Maps, headed by John Scott, president of Center for Public Service Communications; Kurt Menke, a GIS expert and editor of the Community Health Maps blog (https://communityhealthmaps.nlm.nih.gov/), hosted at the National Library of Medicine; and community organizer Jan Booher. Together they customized a training in how to document a King Tide flood and presented it to students and faculty of FIU and members of the South Florida community.
According to the Will It Flood? app, developed by Professor Jacobson and Code for Miami, Shorecrest would likely feel the effects of the high tides after 10:11am on September 20. (You can see a test version of this app, which is still in development, at willitflood.org)
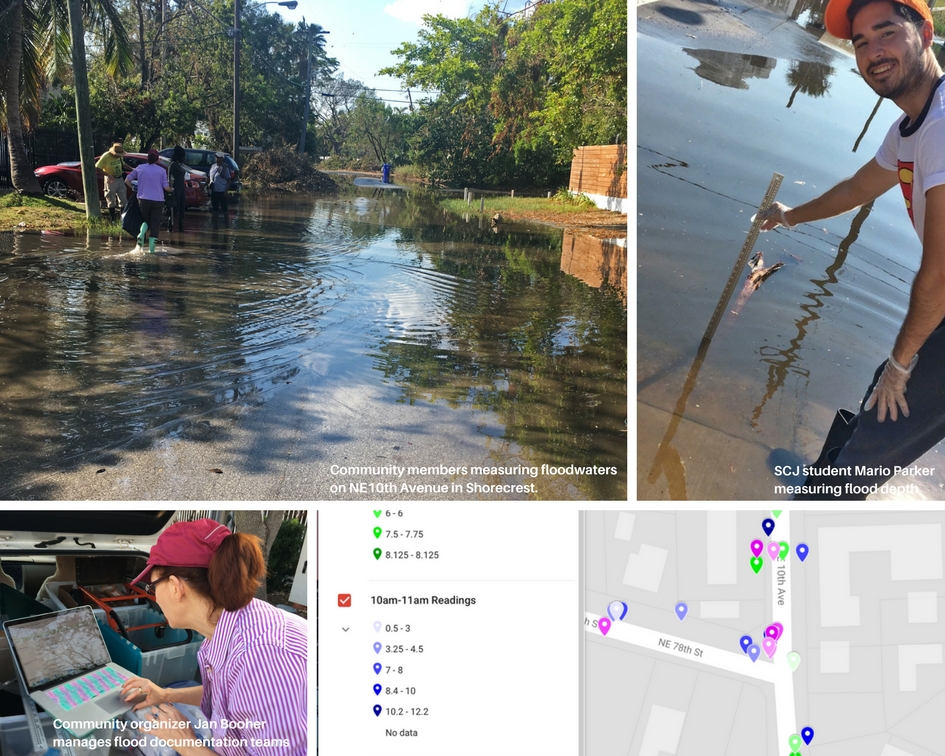
The students and members of the community donned rubber boots and gloves and, using a yardstick, carefully measured the depth of floodwater that emerged from drains and other water sources in the neighborhoods. (When flooding due to King Tides occurs, much of the floodwater comes out through drainage systems.)
The students then measured the salinity of the water using a refractometer. The presence of salinity is a good indicator that the floodwater contains seawater, but even if tidal flooding occurs, the water sometimes does not registered as salty because South Florida has a layer of freshwater just below its surface. The students carefully collected a sample of the floodwater, which was later tested for the presence of coliform. The students then took photos of the floodwaters and uploaded them to a common database using a app created in the Fulcrum platform.
The project let students see, first-hand, the impact of tidal flooding. Although there was no rain in the area, there was water on the streets of Shorecrest in the hour before the high tide. For example, students measured about 6 inches of water on the street at the corner of 79th Street and 10th Avenue. An hour later, the flooding increased significantly, rising to over 8 inches of water, and covering the entire streets. Cars and trucks driving by created a significant wake. An hour after the high tide, the water had receded back to 6 inches in depth.
The data collected by the students and the community members may be used to help citizens and local governments better understand the location, characteristics and extent of flooding during the King Tides. Dr. Jacobson and Dr. Troxler are organizing additional citizen science flood reporting events this fall. Please contact Dr. Jacobson at sujacobs@fiu.edu if you would be interested in participating.
Map of the Shorecrest Project on September 20: https://drive.google.com/open?id=1n8wny4GfdCf3VEyIO_aCNweaP_E&usp=sharing